
Design Role
User Research
UX Design
Stakeholder Alignment
Visual Design
Prototyping
Usability Testing
Deliverable
User Interviews and findings
Wireframes
Visual Design
High Fidelity Prototype
Iterations
Feature Releases & Versioning
Tools
UXPin
Usability Hub
Asana
Overview
Advanced reporting is a tool that allow customers to create custom reports and visual metrics based on the data we have available from their organizations via data feeds.
Project Goals
To create a single reporting solution that will meet the needs of our customers for all of our products. We can then sunset the existing multiple reporting solutions we currently have with limited functionality.
Challenges
- Currently customers with multiple products were having to create individual reports inside each application and export to excel to modify data to achieve their desired output.
- Creating a simple experience for a complex task.
- Meeting WCAG 2.0 compliance .
- Resource constraints.
Design Approach
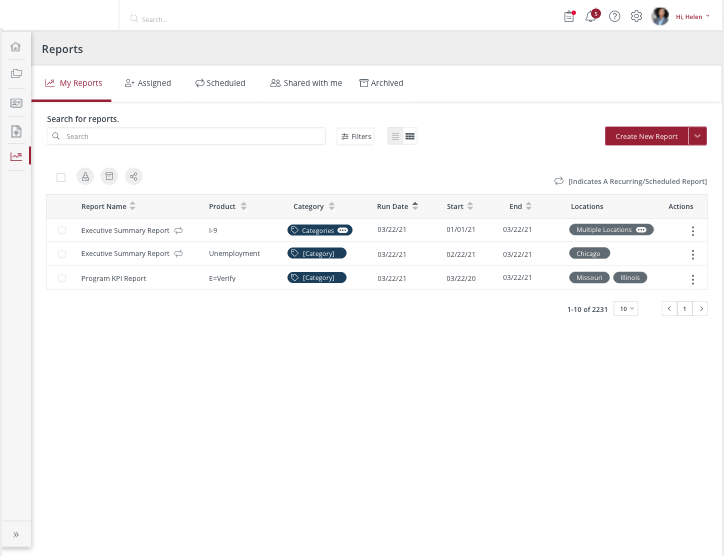
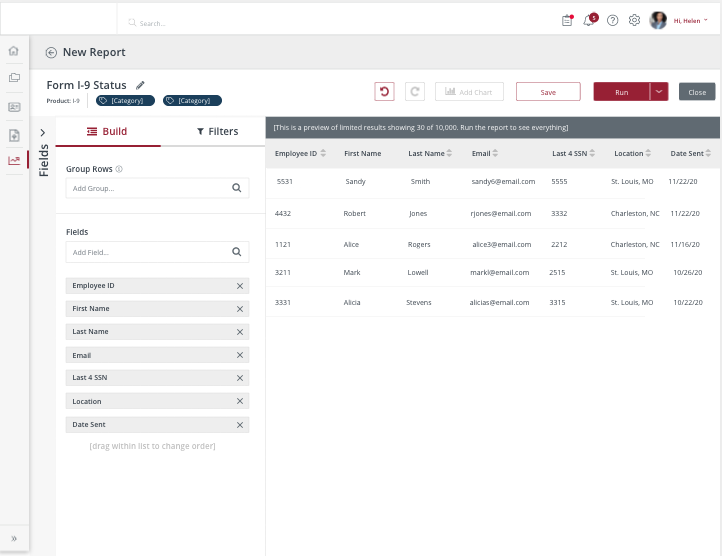
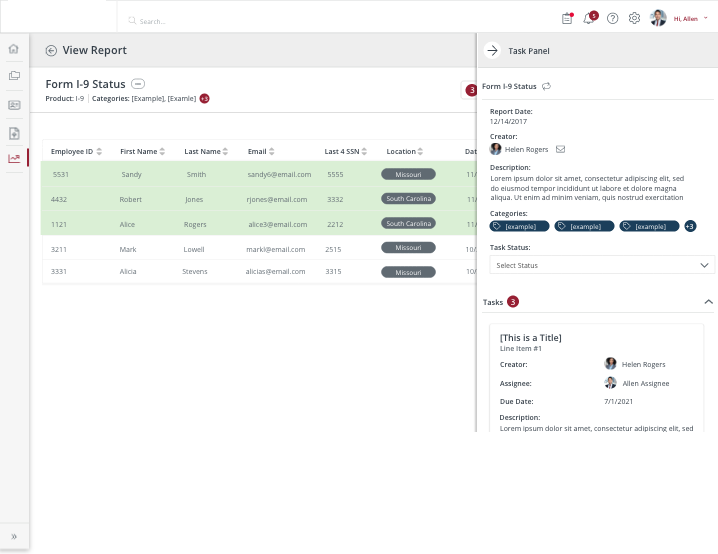
We crafted a phase released approach that allowed the user to create canned reports to offer customers while we were building out an advanced reporting tool. With the new tool, users will be able to build advanced reports with customizable fields, filters, logic groups, summarized reports and visual graphics.
- Saving custom built report templates
- Creating scheduled reports
- Sharing with their community in app
- Rating other team members shared report templates in the community
- Assigning and managing tasks from the report output
- Integrating 3rd party applications to consolidate company data
Topic Research
I researched the process of creating custom reports by becoming an expert in excel and understanding the complex logic grouping skills needed to refine report output. I also looked at how other applications approached advanced customizable builders during a competitive analysis.
My Role & Team
My role for this project was lead designer. I worked with a team of product owners, stakeholders, technology planners and a development team.
User Interviews
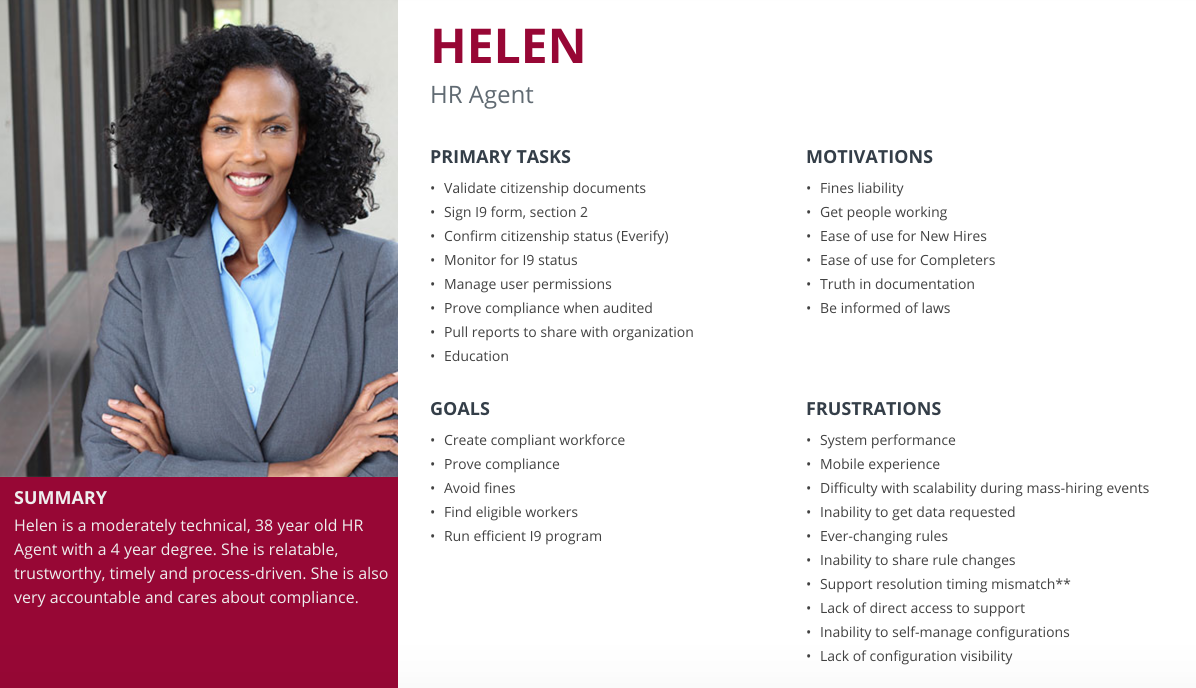
We selected current customers and spoke to their HR agents to learn more about their reporting needs, processes and pain points with their current reporting tools. After all interviews were completed I created a thematic analysis slide deck of my findings to present to stakeholders and validate the need for the proposed experience and enhancements.
16
User Surveys
15
Survey Questions
3
Interviews
Ideation + Validation
I created a prototype of the new UI and features and tested the patterns and task flows in Usability Hub with a curated panel of users.
Persona
User: Helen the HR Agent.
Market: Small and large businesses within the United States.

Execution
Once user interviews were completed and feedback analyzed, it was a good time to start planning user stories and project stages. We crafted a phased release plan and crafted user stories to build our product backlog. Created process flows and interactive prototypes in UX Pin to review with stakeholders during the design and development process and held weekly UX and dev reviews as designs were approved by stakeholders and released for development.
Wireframes + User Flow

Final Product
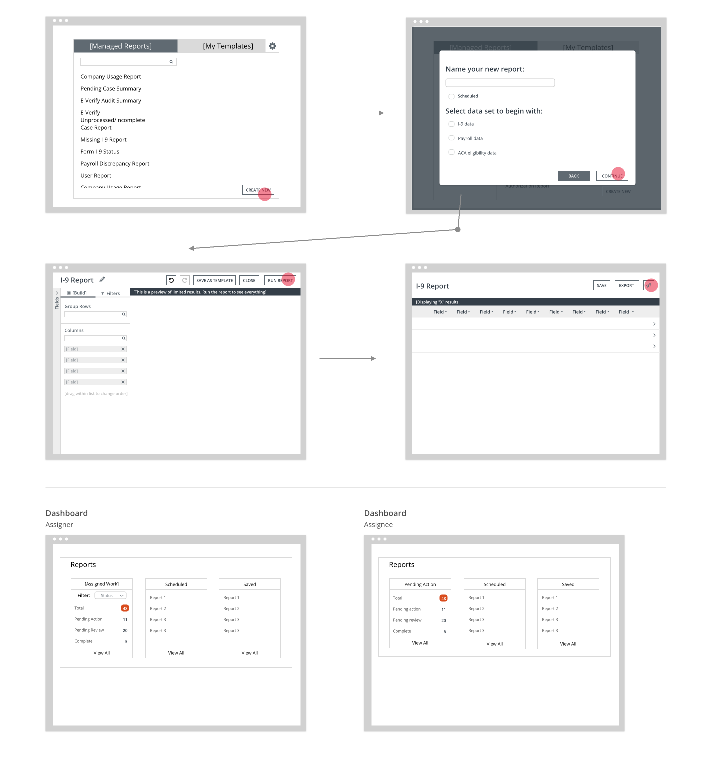
After taking feedback from the research phase of the project, low fidelity designs and user flows were created and vetted with product owners to ensure the new experience met expectations and developmental restrictions. The new solution gave users the ability to select data points across all of our umbrella of applications to create truly unique reporting solutions.


Learnings
This project gave me an understanding of the intricate technological and data mapping that goes into creating custom reports with advanced logic.
I also became familiarized with the complex concept of creating user friendly data visualization experiences. We utilized Highcharts, a JavaScript charting library, to aid in the development of users ability to create interactive and customizable data visualizations like charts, graphs, and maps. It became a pivotal tool in the organizations strategy to create dashboards, reporting tools, and data-driven applications.